

Novice Investor #24 - The Death of Rule of 40, New Investments & Exits & What Would You Pay
Novice Investor #24 - The Death of Rule of 40, New Investments & Exits & What Would You Pay

Happy 2024 All!
In the last issue of this newsletter, I mentioned how technology company fundraising and M&A had effectively collapsed in 2023. Well, at Kennet, we are happy to be helping the numbers rebound in 2024. A couple of weeks ago we announced the exit of Eloomi to US public software company, Ceridian, making a 3x return on our investment.
Just last week, I was very proud to complete Kennet’s first-ever deal based in Ireland, backing Screendragon, with Federated Hermes investing alongside us. I’m looking forward to working with the company over the next few years.
What Would You Pay - Round 2
In the last post, I asked you all to value three hypothetical software companies for me. Many thanks to everyone who voted. The data is extremely interesting and very helpful for me in trying to better understand SaaS company valuations. The results of the poll are at the bottom of this post. If you get any value from this newsletter, I kindly ask you to do the same again and vote on the below companies. As a reminder it is anonymous and I will share the aggregate results in the next issue.
Charlie Software
A US B2B SaaS company with a low-cost Human Capital Management product. Charlie sells into a very large market with a TAM of €10 Billion. Charlie is founded and led by an experienced entrepreneur with a prior successful exit in the same sector.
Charlie finished last month with ARR of €15m, reflecting 90% YoY growth. Charlie generates gross margins of 85%, EBITDA margins of negative 50%, net revenue retention of 120%, gross revenue retention of 80% and spent €9.0m on Sales and Marketing in the last twelve months.
Charlie just launched a Series C funding round and is seeking to raise €30,000,000.
Bridge Software
A European B2B SaaS company with a differentiated Sales & Marketing product. Bridge sells into a large market with a TAM of €5 Billion. Bridge is founded and led by an experienced software developer.
Bridge finished last month with ARR of €6m, reflecting 35% YoY growth. Bridge generates gross margins of 75%, EBITDA margins of 20%, net revenue retention of 110%, gross revenue retention of 90% and spent €1.0m on Sales and Marketing in the last twelve months.
Bridge just launched a Series B funding round and is seeking to raise €10,000,000.
Echo Software
A European B2B SaaS company with a competitive Financial Applications product. Echo sells into a sizeable market with a TAM of €2 Billion. Echo is founded and led by a first-time founder with strong domain experience.
Echo finished last month with ARR of €5m, reflecting 45% YoY growth. Echo generates gross margins of 80%, EBITDA margins of negative 10%, net revenue retention of 115%, gross revenue retention of 95% and spent €1.5m on Sales and Marketing in the last twelve months.
Echo just launched a Series B funding round and is seeking to raise €15,000,000.
The Death of Rule of 40
Back in July of last year, I mentioned how the Rule of 40 was a flawed metric for private companies and how you should all stop using it. Since then, I have had several board-level debates with advisors and investors on why it doesnt make sense. I was glad to see a fellow maths nerd at BVP share a similar opinion which they highlighted in their recent post on a new metric, the Rule of X. Highly recommend giving it a read.
So here is my mini-thesis on why bankers should stop including scatter plots of TEV / Revenue multiples against Rule of 40.
To start what is the Rule of 40? It is a neat metric that attempts to balance the trade-off between Growth and Cash Flow. It says companies should aim for a balance of Growth and Cash Flow of 40%. In the private markets, we use the following formula:
Rule of 40 = LTM ARR Growth Rate % + LTM Free Cash Flow Margin %
Also, it is worth pointing out two things about the analysis:
This is an analysis of why Rule of 40 does not work. Not an analysis on an alternative. We can save that for another post.
The key hypothesis to prove or disprove is.. if Rule of 40 is a useful metric, we assume it has a strong correlation to valuation multiples. We assume the Rule of 40 is positively correlated to Total Enterprise Value / LTM Revenue Multiples
Introduction to Simple Regression Analysis
A reminder of what a simple regression is. You have a dataset with two metrics you believe might be correlated. You create a scatter plot of all the observations with one metric reflected on the x-axis (independent variable) and the other metric on the y-axis (dependent variable). A regression analysis is essentially asking Excel or other statistical software to draw a straight line through your data that minimises the distance between all your observations and the line. This straight line can also be illustrated by a linear formula with a constant and one independent variable such as:
Y = C + X
Where Y is the dependent variable you are trying to estimate, C is a constant and X is the independent variable you believe has influence on Y.
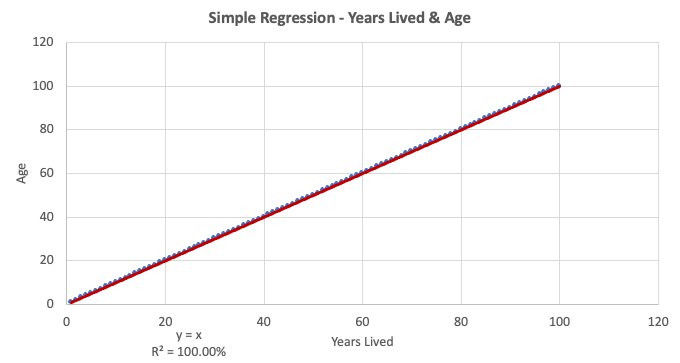
To give an example, if you take two metrics that are perfectly correlated such as X = years lived and Y = Age, you would get a graph and formula like below. Note how the line perfectly tracks all the data observations as there is a perfect correlation between the two metrics. The formula for the line is also very simple and intuitive as “ Y = X” (the constant C is zero). So if you know how many years you have lived, for example, you have lived 20 years. Now you can plug your data point into this nifty formula to estimate your age.
Y (age) = X (Years Lived)
Y (age) = 20
Congratulations, you have figured out you are 20 years old.
Now let’s look at a counter-example with very little correlation. Let our dependent variable be Micorosft’s Annual EBITDA Margin % (Y) and our independent variable be the annual number of global UFO sightings (X).
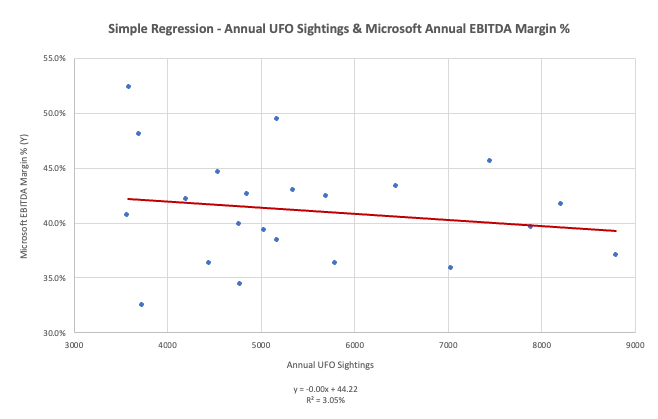
As you can see, the observations are quite randomly scattered across the chart. There seems to be little gravity of the points towards the trend line. This visual illustration of whether the points are correlated is neatly quantified in a metric called R-squared (included at the bottom of both charts). Without getting too into the maths, an R-squared tells you how well a regression model (or line/linear formula) explains your data. It ranges from 0% to 100%. At 100%, your linear formula explains your data perfectly and can estimate the Y variable with perfect accuracy just as our Age and Years Lived regression above. Whereas an R-squared close to 0% does a very bad job of explaining the data. For instance, I doubt any hedge fund analyst will be using my second regression above to predict Micorosft’s 2024 EBITDA Margin %.
It is worth noting, that the R-squared metric does not benchmark well across data sets. Using public company data (which is influenced by many external and unknown factors), an R-squared of 40% - 60% is acceptable. While other more constrained data sets would require a higher R-squared to get comfort on explanatory power.
Simple Regression - Rule of 40 & TEV / LTM Revenue Multiples
So now let’s see how well the Rule of 40 impacts valuation in public software companies. Given so many people obsess over the metric, one would assume it should have pretty good explanatory power on valuation multiples. For our example, we will use Total Enterprise Value / LTM Revenue multiples which is a good proxy for our private market pre-money valuation / Annual Recurring Revenue multiples. The data is taken from c. 200 public software companies.
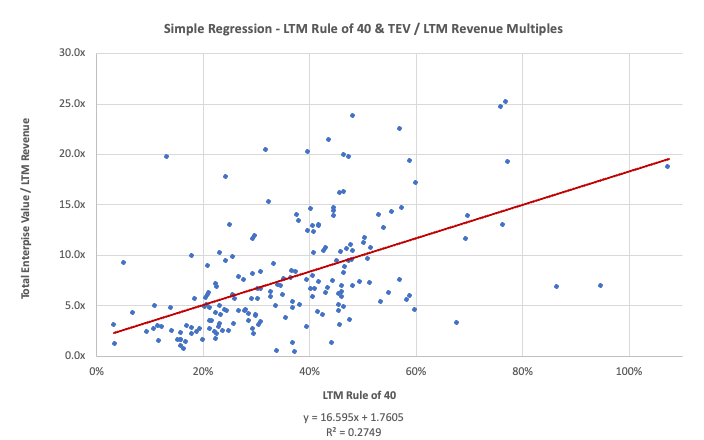
Surprisingly for some, the Rule of 40 does not have great explanatory power on public software company valuation with an R-squared of 27.49%.
A big reason for the low explanatory power is a key difference in how public and private companies are analysed. Your typical public company is professionally followed by multiple independent analysts who forecast future financial performance with good accuracy. As such, future financial estimates are credible, are more interesting for valuation purposes and so have much better explanatory power on valuation multiples compared to historical data. Compare this to private company analysis. Any experienced investors will tell you that 99% of startups miss their forecasts. As such, we all (at least should) value companies on actual performance i.e. LTM metrics.
Now let’s look at the same regression, with the same companies, only using the Next Twelve Months Rule of 40 metrics on the LTM Revenue Multiples
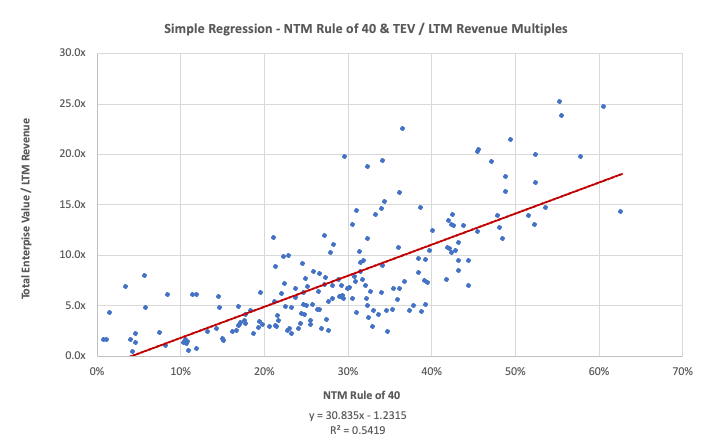
As you can see, the forward or NTM Rule of 40 metrics has good explanatory power on valuation multiples with an R-squared of 54.19%. So the efficacy of NTM Rule of 40 as a good metric for valuation is strongly supported here. The only problem is, in the private world we base our Rule of 40 on LTM metrics. As we all know growth tends to decrease with scale so there is a disconnect we don’t correct for in the metric.
Conclusion - We need a correction for LTM vs NTM metrics
Multi-variate Regression Analysis - TEV / LTM Revenue Multiples
Another issue with the Rule of 40 and in my opinion by far the biggest issue, lies in the Rule of 40’s implied weightings of Growth and Cash Flow. The implicit linear equation of valuation multiples according to the Rule of 40 would be something like the following:
Valuation multiple = C + c1*NTM Revenue Growth % + c1*NTM Free Cash Flow Margin %
Where C is some constant and c1 is the coefficient of both Growth and Cash Flow. Note that the formula implies this coefficient is the same for both variables.
Now let’s look at a slightly more advanced regression technique to compare the above equation to real-life data. For this regression analysis, we will increase the independent variable from one to two. This effectively adds an axis to the chart and turns our graph 3D. Given I’m too lazy to try to embed a 3D graph in this newsletter, we will keep the graph the same as the simple linear regression, just focus on the linear equation for this analysis. It will look like the below and has the same structure as our implied Rule of 40 equation above:
Y = C + c1*X + c2*Z
The big difference between this equation and the Rule of 40 equation is that the coefficients of X (NTM Revenue Growth %) and Z (NTM Free Cash Flow Margin %) are not constrained to be the same. Instead, we will let the data decide what they are by doing the regression analysis. For this analysis, we will take the same group of software companies and let X = NTM Revenue Growth %, Z = NTM Free Cash Flow Margin % and Y = Total Enterprise Value / LTM Revenue (our proxy for ARR valuation multiples). Here is the output:
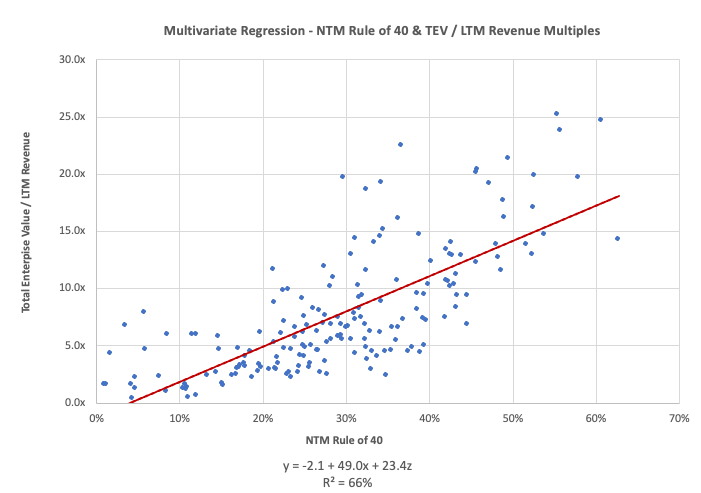
First of all, by adding two variables to the regression we effectively remove the equal weighting constraint on Growth and Cash Flow that the Rule of 40 implies. This has a meaningful impact on the R-squared of the regression which now sits at 66% (this is very good for public company data). Secondly, when we let the data decide, the coefficient on Growth (X) is 49.0 and Cash Flow (Z) is just 23.4. This means Growth has 2.1x more impact on valuation multiples compared to Cash Flow.
Again, the Rule of 40 implies an equal proportional impact of Growth and Cash Flow on valuation multiples. However, when we analyse the data, public markets imply Growth has a much higher impact on valuation multiples.
I was interested to see how the relationship between the coefficients of Growth and Cash Flow changed over the years. So I painstakingly did way too many regressions over ten years. Below is the multiplier of the coefficient of NTM Revenue Growth % divided by the coefficient of NTM Free Cash Flow Margin %. Effectively, how much more impact Growth has on valuation multiples compared to Cash Flow. Let’s call it “Multiplier”.

The Rule of 40 implies a “Multiplier” of 1.0x (equal weightings). As you can see from the above table, this has never been the case. The average Multiplier over the past ten years has been 3.1x and this excludes a 1.5-year period in 2020/2021 when things got out of control. Funnily, during most of this period, the coefficient of NTM Free Cash Flow Margin % was statistically insignificant i.e. it had no impact on valuation. Funnier again, in June 2021, it had a statistically significant negative coefficient, meaning positive Free Cash Flow Margin % negatively impacted your valuation multiple. You couldn’t make this stuff up.
Conclusion - Public software company data suggests Growth has a much higher impact on valuation multiples than Cash Flow. A multiplier of 1.0x is way off the mark.
Multivariate Regression - Theoretical Data Using the SaaS DCF Model
The last two proof points on why Rule of 40 doesn’t work well were based on empirical data from public markets. Now let’s look at a more theoretical, closed-loop reason why the Rule of 40 is not a good metric for determining SaaS company valuation. Last year I published a DCF model specifically for SaaS companies (growth-constrained model). It uses fairly agreeable assumptions to project cashflows and value any SaaS business. There are seven inputs to the model, but let’s hold all of them constant except for LTM ARR Growth % and LTM Free Cash Flow Margin % (the Rule of 40 constituents).
The below table is a Data Table from Excel which gives the output of my model (implied ARR multiple) for each corresponding input for the two different variables (LTM ARR Growth % on the top and Free Cash Flow Margin % on the side).
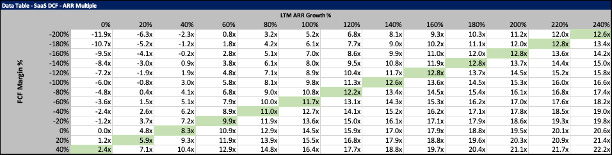
All of the cells highlighted in green reflect when both inputs add up to a Rule of 40 of 40%. Now, if the Rule of 40 was a good metric for valuing a business, you would expect a fairly consistent valuation multiple across scenarios where the Rule of 40 = 40%. However, we see that a Rule of 40 with a higher LTM ARR Growth % has a much higher valuation. The range is quite extreme from a 2.4x multiple with an ARR Growth of 0% and a 12.6x multiple with an ARR Growth of 240%. This suggests we should weight LTM ARR Growth % higher than Free Cash Flow Margin %. But by how much?
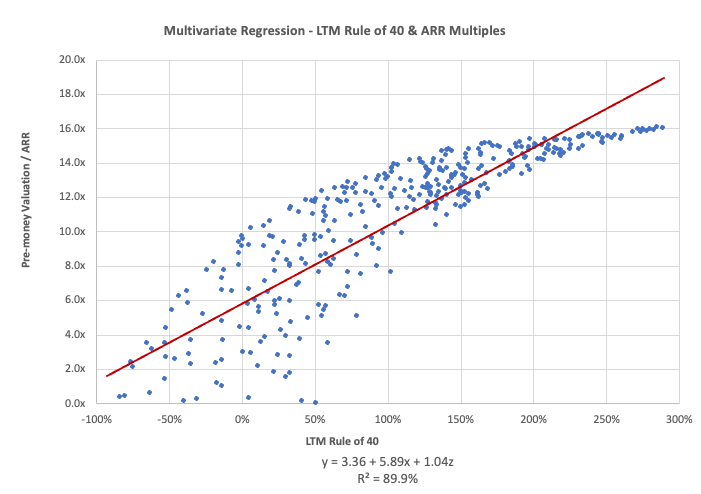
If we do a multivariate regression of randomly generated inputs for LTM ARR Growth % and Free Cash Flow Margin %, we get the below familiar chart. Noting the chart is a simple regression for just Rule of 40, while the equation below shows the multivariable regression output.
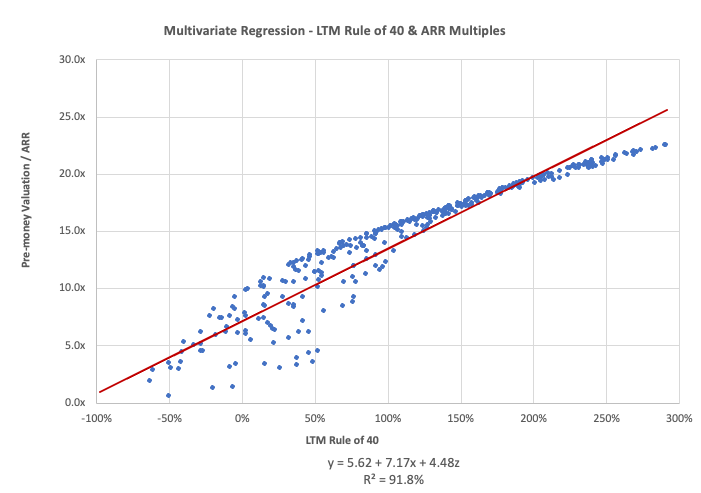
The coefficient of Growth (X) is 7.17 compared to the coefficient of Cash Flow (Z) at just 4.48.
Conclusion - The SaaS DCF model equation to predict valuation multiples implies that Growth is 1.6x more important than Cash Flow.
Multivariate Regression - Theoretical Data using the VC Method Model
Now let’s do the same exercise, but using a different theoretical, closed-loop, model, the VC Method model. While this model takes a different approach in projecting and valuing future cashflows, it still follows a reasonably agreeable set of assumptions to value SaaS companies. Again, we hold all other inputs constant except for LTM ARR Growth % and LTM Free Cash Flow Margin % to produce the following outputs:
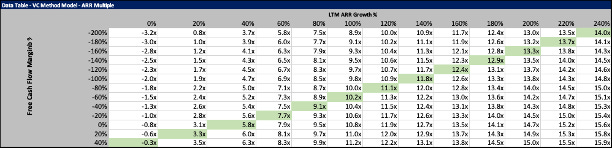
Once again, we see that the scenarios where the Rule of 40 = 40% differ significantly. Each output ARR valuation multiple clearly increases with higher Growth, suggesting LTM ARR Growth % is a more important driver of valuation multiples than LTM Free Cash Flow Margin %.
If we do a multivariate regression, we get the following output:
The coefficient of Growth (X) is 5.89 compared to the coefficient of Cash Flow (Z) at just 1.04.
Conclusion - The VC Method model equation to predict valuation multiples implies that Growth is 5.6x more important than Cash Flow.
What Would You Pay Results
The final proof point of why the Rule of 40 doesn’t work is a bit more anecdotal. In my last newsletter, I presented three hypothetical software companies and asked everyone to vote on what ARR valuation multiple they would pay to invest in the company. Effectively a market-tested valuation approach. The results are below:
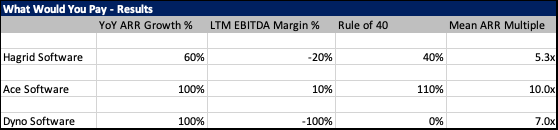
While certainly not statistically conclusive proof on the effectiveness of the Rule of 40 metric, it does shed light on the debate. You, the readers of this newsletter, valued Hagrid Software, with a Rule of 40 of 40%, at 5.3x. You also valued Dyno Software, with a Rule of 40 of 0%, much higher at 7.0x ARR. Again, this points to the fact that Growth is much more important for valuation multiples than Cash Flow.
Conclusion - You thought a company with a Rule of 40 of 0% is worth more than a company with a Rule of 40 of 40%
Death of Rule of 40 Conclusion
To succinctly conclude, we reasonably proved two things wrong with the Rule of 40 metrics:
The metric predicts valuation multiples well in the public market, but only when using forecasted Growth and Cash Flow. How we use it in the private market with LTM metrics needs an adjustment
No matter what period, what statistical approach or what data (empirical, theoretical or survey), Growth is much more important and impactful on valuation than Cash Flow.
Stop paying so much attention to the Rule of 40 when valuing businesses or approving budgets. Cash Flow is important to make sure you don’t go bankrupt, but if you want to maximise value, maximise Growth.
What Would You Pay Results
Hagrid Software - Valued at 5.3x ARR
A European B2B SaaS company with a differentiated Dev Ops product. Hagrid sells into a large market with a TAM of over €3 Billion. Hagrid is founded and led by a second-time entrepreneur who hopes to make this start-up a greater success.
Hagrid finished last month with ARR of €5m, reflecting 60% YoY growth. Hagrid generates gross margins of 80%, EBITDA margins of negative 20% and net revenue retention of 110%.
Hagrid just launched a Series B funding round and is seeking to raise €10,000,000.
Ace Software - Valued at 10.0x ARR
A US B2B SaaS company with the leading ERP & Supply Chain product. Ace sells into a very large market with a TAM of €10 Billion. Ace is founded and led by a serial entrepreneur with two prior successful start-ups.
Ace finished last month with ARR of €15m, reflecting 100% YoY growth. Ace generates gross margins of 85%, EBITDA margins of 10% and net revenue retention of 130%.
Ace just launched a Series C funding round and is seeking to raise €30,000,000.
Dyno Software - Valued at 7.0x ARR
A European B2B SaaS company with a differentiated Sales & Marketing product. Dyno sells into a sizeable market with a TAM of €1 Billion. Dyno is founded and led by a first-time entrepreneur with strong domain experience.
Dyno finished last month with ARR of €3m, reflecting 100% YoY growth. Dyno generates gross margins of 70%, EBITDA margins of negative 100% and net revenue retention of 120%.
Dyno just launched a Series A funding round and is seeking to raise €7,000,000.
Kennet Partners’ Investment Target
Kennet Partners is a Growth Equity investor with over 20 years of experience partnering with European and US SaaS companies. If you know any companies which fit our criteria, please reach out.
Investment size: $8m - $30m
Maturity: Over $3m in ARR
Growth: > 30%
Type: Bootstrapped and capital-efficient B2B SaaS businesses
Geography: Europe & US
Disclaimer: None of the content in the Newsletter should be taken as financial advice.